The backlog of new power generation and energy storage seeking transmission connections across the U.S. grew again in 2023, with nearly 2,600 GW of generation and storage capacity now actively seeking grid interconnection, according to new research from Lawrence Berkeley National Laboratory. Active capacity in U.S. interconnection queues increased nearly eight-fold over the last decade, and is now more than twice the total installed capacity of the existing U.S. power plant fleet. The queues indicate particularly strong interest in solar, battery storage, and wind energy, which together accounted for over 95% of all active capacity at the end of 2023.
But this growing backlog has become a major bottleneck for project development: proposed projects are mired in lengthy and uncertain interconnection study processes, and most interconnection requests are ultimately cancelled and withdrawn. The Federal Energy Regulatory Commission (FERC) adopted major interconnection reforms in 2023 that have not yet taken effect in most regions; project developers continue to cite grid interconnection as a leading cause of project delays and cancellations. Submitting an interconnection request and completing the requisite grid studies is only one of many steps in the development process; projects must also have agreements with landowners and communities, power purchasers, equipment suppliers, and financiers, and may face transmission upgrade requirements. Data from these queues nonetheless provide a general indicator for mid-term trends in power sector activity and energy transition progress.
Berkeley Lab compiled and analyzed data from the seven organized electricity markets (RTO / ISOs) in the US and an additional 44 balancing areas outside of RTO / ISOs, which collectively represent over 95% of currently installed U.S. electricity generation. The findings are reported in a new slide deck, data file and interactive visualization that synthesize data from transmission interconnection queues throughout the United States to illustrate trends in proposed power plants across technologies, time, and regions. This latest edition of the annual “Queued Up” report also includes an array of new analytical additions such as post-Inflation Reduction Act (IRA) queue volumes, analysis of energy-only versus network interconnection service trends, and a summary of key regulatory activity at the federal and regional levels.
U.S. electric demand is projected to increase considerably in coming years, with a resurgence in U.S. manufacturing alongside demand from new data centers, electric vehicles, and building electrification. Connecting new electric generation and storage is urgently needed to meet this growing demand. Energy storage is particularly well-suited to provide needed reliability services and is surging in interconnection queues nationwide.
“It is promising to see the unprecedented interest and investment in new energy and storage development across the U.S., but the latest queue data also affirm that grid interconnection remains a persistent bottleneck,” said Joseph Rand, an Energy Policy Researcher at Berkeley Lab, and lead author of the study. “The new rules from FERC will be a step in the right direction when implemented, but it is increasingly clear that additional solutions to interconnection problems are essential to maintain grid system reliability amidst rising electricity demand and utility- and state-level clean energy goals,” added Rand.
A supercharged market for clean energy development
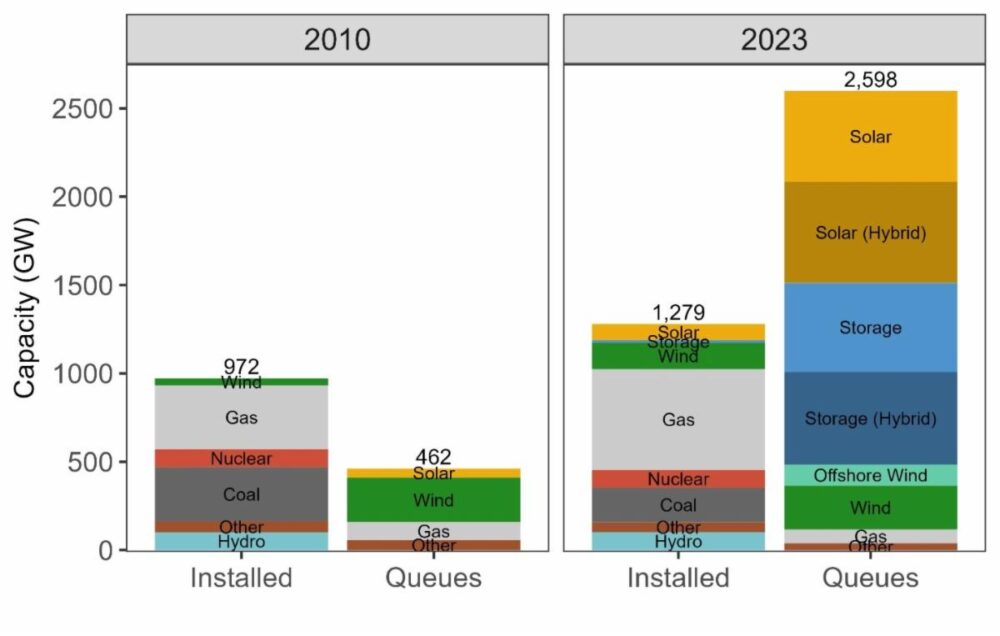
The total capacity in the queue at the end of 2023, nearly 2.6 terawatts (TW), is more than twice the current U.S. generating capacity of 1.28 TW, and roughly eight times larger than the queue in 2014.
 Figure 1: Installed U.S. electric generating capacity compared to interconnection queue capacity (2010 and 2023)
Solar (1,080 GW) accounts for the majority of generation capacity in the queues. Substantial wind (366 GW) capacity is also actively seeking grid connection. The amount of offshore wind capacity in the queues (120 GW) represents four times the Biden Administration’s goal of 30 GW installed by 2030. Developer interest in electricity storage ballooned in recent years, with capacity in the queues growing more than 50% in the past year to roughly 1,030 GW.

Figure 2: Active capacity in interconnection queues by transmission grid operating region
Remarkably, the overall growth of capacity in the queues occurred despite major slowdowns in two of the largest grid operating regions: MISO and PJM. Due to the massive influx of new interconnection requests in 2022, MISO did not accept any new requests in 2023 as it sought approval for sweeping procedural reforms. Similarly, PJM announced that it would not review any new requests until at least 2025, resulting in relatively few new requests in 2023. Yet, these slowdowns were more than offset by enormous growth in other regions — particularly CAISO (which had a record-breaking number and capacity of new requests in 2023), the non-ISO West and ERCOT. CAISO since proposed to delay its 2024 application window to the following year.
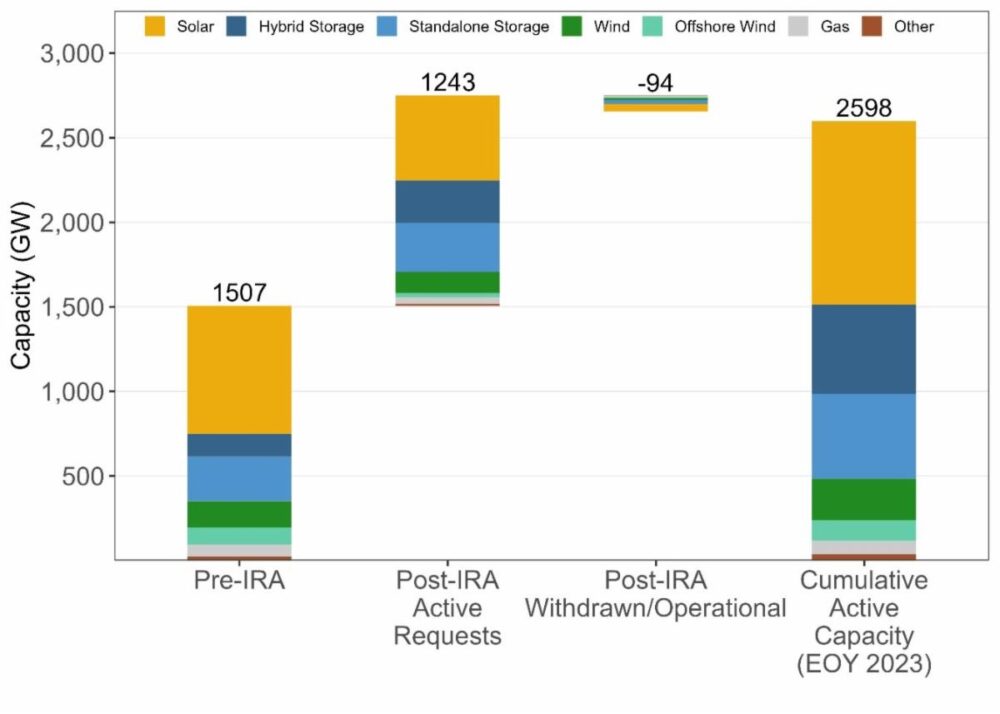
Without a doubt, some of the clean energy capacity entering the queues in 2023 was incentivized by the Inflation Reduction Act (IRA), which was signed into law in August 2022, and included a range of tax incentives and related provisions aimed to reduce power-sector greenhouse gas emissions. Interconnection requests were already trending upward prior to the IRA, but that trend has only accelerated: over 1,100 GW of solar, storage and wind projects submitted interconnection requests since the passage of the IRA. “The IRA supercharged the already-vigorous market for clean energy and storage development,” said Nick Manderlink, a co-author of the new report. “But while the IRA improved economic certainty for projects, other uncertainties — like grid interconnection and permitting — remain challenging,” added Manderlink.

Figure 3: Active capacity in interconnection queues before and after the passage of the Inflation Reduction Act (IRA)
Increasing interest in co-locating generation with storage
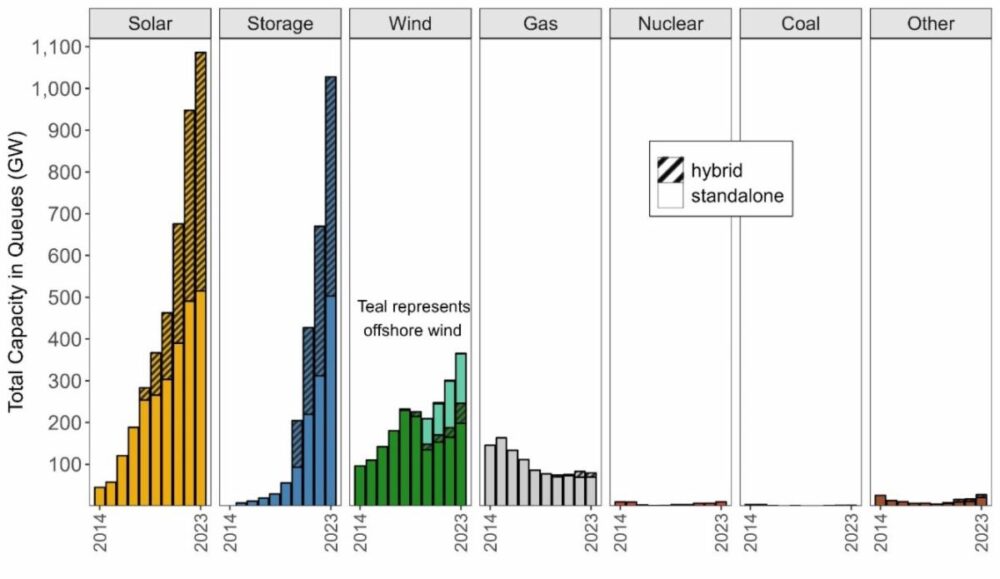
With falling battery prices and the growth of variable renewable generation, there has been a surge of interest in “hybrid” power plants that typically combine generating capacity with co-located batteries. 571 GW of solar capacity in the queues are proposed as hybrid plants (53% of all solar in the queues), as is 49 GW of wind (13% of all wind in the queues). Over half of all storage capacity in the queues is proposed in hybrid configurations with generation (525 GW).
Interest in hybrid projects is especially strong in CAISO and the non-ISO West, where 98% and 81% of all proposed solar is in a hybrid configuration, respectively.
“Pairing electric generation with co-located storage can add market value and flexibility, especially in regions with a lot of solar and wind like California,” said co-author Will Gorman, a Research Scientist at Berkeley Lab.
Even with the recent passing of the IRA, which boosted incentives for standalone storage, the demand for hybridization remained high in 2023.

Figure 4: Total and hybrid capacity in interconnection queues over time. *Hybrid storage capacity was estimated for some projects using known generator:storage ratios and was not estimated for years prior to 2020.
Backlogs, bottlenecks and barriers: opportunities for improvement
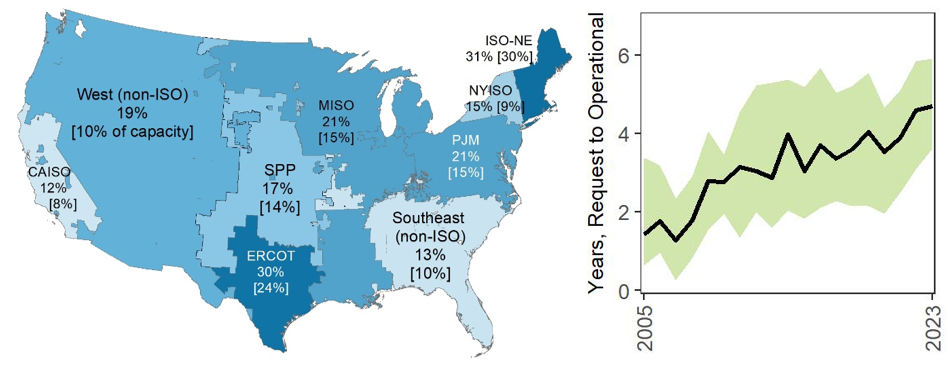
But there is a big caveat: much of the proposed capacity in the queues will not ultimately be built since projects may not come to fruition for a variety of reasons. Looking back at a subset of queues for which data are available, only 19% of the projects (and just 14% of capacity) that submitted interconnection requests from 2000 to 2018 reached commercial operations by the end of 2023 (final outcome of more recent projects cannot yet be determined). Concerningly, later-stage withdrawals may be becoming more common, which can be costly for developers and can disrupt assumptions built into other projects’ interconnection studies, potentially lengthening study durations.
Another concerning trend is that interconnection wait times are on the rise. Interconnection requests now typically take more than three years to complete the requisite grid impact studies in most regions, though some — like ERCOT in Texas — are processing requests more quickly. The timeline from the initial connection request to having a fully built and operational plant has increased from less than two years for projects built in 2000-2007 to more than four years for those built in 2018-2023.

Figure 5: Completion rates (for requests from 2000-2018) and typical duration to reach commercial operations for projects in the queues. Capacity-weighted completion rates shown in brackets [X%]
The large backlogs, wait times and withdrawal rates in the queues suggest persistent interconnection and transmission challenges and highlight the need to improve institutional processes, some examples of which are underway. In July 2023, FERC adopted Order 2023, which requires substantial reforms to interconnection procedures such as utilizing a cluster (first-ready, first-served) rather than a serial (first-come, first-served) approach, higher deposits and readiness requirements to enter the queue, and stricter timelines and penalties. Order 2023 represents a significant step in the right direction toward addressing these interconnection challenges, but implementation across the U.S. is still underway. Several regional grid operators such as MISO, CAISO, PJM and ERCOT have already implemented or proposed additional reforms that go beyond the requirements of Order 2023.
This data compilation and analysis were conducted by Berkeley Lab, with support from the U.S. Department of Energy’s Office of Energy Efficiency and Renewable Energy, in particular the Solar Energy Technologies Office and Wind Energy Technologies Office via the Interconnection Innovation Exchange (i2X) program.
News item from Berkeley Lab


