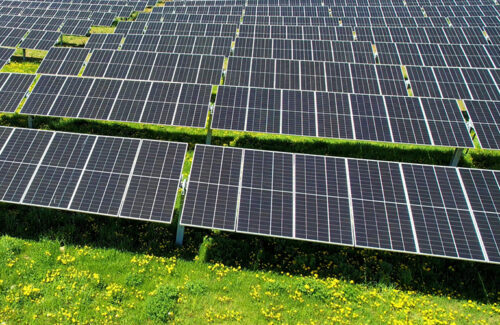
A review by the SUN DAY Campaign of data released by the Federal Energy Regulatory Commission (FERC) reveals that the combination of solar and wind accounted for 90% of new U.S. electrical generating capacity added in the first seven months of 2025. In July, solar alone provided 96% of new capacity, making it the 23rd consecutive month in which solar has held the lead among all new energy sources.

Credit: Alliant Energy
In its latest monthly “Energy Infrastructure Update” report (with data through July 31, 2025), FERC says 46 “units” of solar totaling 1.181 GW were placed into service in July, accounting for over 96.4% of all new generating capacity added during the month.
The new facilities include the 202.8-MW Estonian Solar & Storage Expansion Project in Delta County, Texas; the 200-MW Eland Solar Farm and the 150.0-MW Northern Orchard Solar PV project, both in Kern County, California; and the 150.0-MW Coldwater River Solar Project in Branch County, Michigan.
The 434 units of utility-scale solar added during the first seven months of 2025 total 16.05-GW and were almost three-quarters (74.4%) of the total new capacity placed into service by all sources.
Solar has now been the largest source of new generating capacity added each month for twenty-three consecutive months: September 2023 to July 2025. During that period, total utility-scale solar capacity grew from 91.82 GW to 153.09 GW. No other energy source added anything close to that amount of new capacity. Wind, for example, expanded by 10.68 GW while natural gas increased by just 3.74 GW.
For the first seven months of 2025, the combination of solar and wind (plus 4 MW of hydropower and 3 MW of biomass) was 89.6% of new capacity while natural gas provided just 10.2%; the balance came from coal (18-MW), oil (17 MW), and waste heat (17 MW).
Solar + wind are almost a quarter of U.S. utility-scale generating capacity
Utility-scale solar’s share of total installed capacity of (11.42%) is now almost equal to that of wind (11.81%). Taken together, they constitute nearly one-fourth (23.23%) of the U.S.’s total available installed utility-scale generating capacity. At least 25% of U.S. solar capacity is in the form of small-scale systems that are not reflected in FERC’s data.
With the inclusion of hydropower (7.61%), biomass (1.07%) and geothermal (0.31%), renewables currently claim a 32.22% share of total U.S. utility-scale generating capacity. If small-scale solar capacity is included, renewables are now more than one-third of total U.S. generating capacity.
Solar remains on track to become the second largest source of U.S. generating capacity
FERC reported that there is a “high probability” addition of 92.631 GW of solar between August 2025 and July 2028, compared to wind’s predicted 22.528-GW of new capacity. Combined with other expected renewable energy additions, a total of 115.12 GW of new capacity could be added to the grid during the remainder of President Donald Trump’s term.
“With one month of Trump’s ‘One Big Beautiful Bill’ now under our belts, renewables continue to dominate capacity additions,” said Ken Bossong, executive director of the SUN DAY Campaign. “And solar seems poised to hold its lead in the months and years to come.”
News item from the SUN DAY Campaign


